K-Means Case Study
This article is an example of practical use for k-means clustering from a case study conducted in a Chinese city. The project comes from the IoT smart city concept and looks at real-time traffic network data and uses the k-means algorithm to analyze real data. The emerging intelligent transportation techniques are helping the urban environment run smoother though very complex. The authors take a small segment and look at supply chain logistics such as for manufacturing (raw materials), utilities (coal), banking (banknotes), and the cost related to the processing and transportation between the center and the supplier points. The study is a hotel supply chain with 618 hotel locations and 5-30 service suppliers. The algorithm uses real-time data to find the optimum transportation network that also has the lowest real cost. It takes a business center’s location, the cost to transport and makes a weighted index that defines the processing centers’ quality and locations to transport goods using the k-means algorithm.
The goal is to divide the city into smaller areas and locate the center to get the lowest comprehensive cost (weighted). The authors talk about the model used and how it is dependent on the initial cluster centers, which could result in unstable clustering results and a large increase in iterations. With k-means, the cluster centers get selected randomly and have significant contingency; they use the gradient method to find the best values. They choose the initial cluster centers carefully because improper initial values the results won’t be convergent. For this study, they want to make the similarity of all the objects in one cluster as high as possible, and the separation between different clusters well defined. The authors use GIS to map out the region and to calculate distances. The authors described the k-means: take the transportation fee, a transportation coefficient, and the location of the supplier and number of orders placed (frequency). The cluster generates the best route with the lowest cost. Remember, this is a real-time system; thus, it is dynamic and can regenerate clusters. Figure 1 below is an example of the clustering algorithm overlaying a map in GIS. The k-means was run 26 times to get the initial cluster centers. The regions divided up into 5, 10, 20, 25 distribution centers. The study discusses the cost model and how that was created and shows that the transportation cost is lowered with more centers and optimal was 25 service centers. See the reference if you are interested in further details.
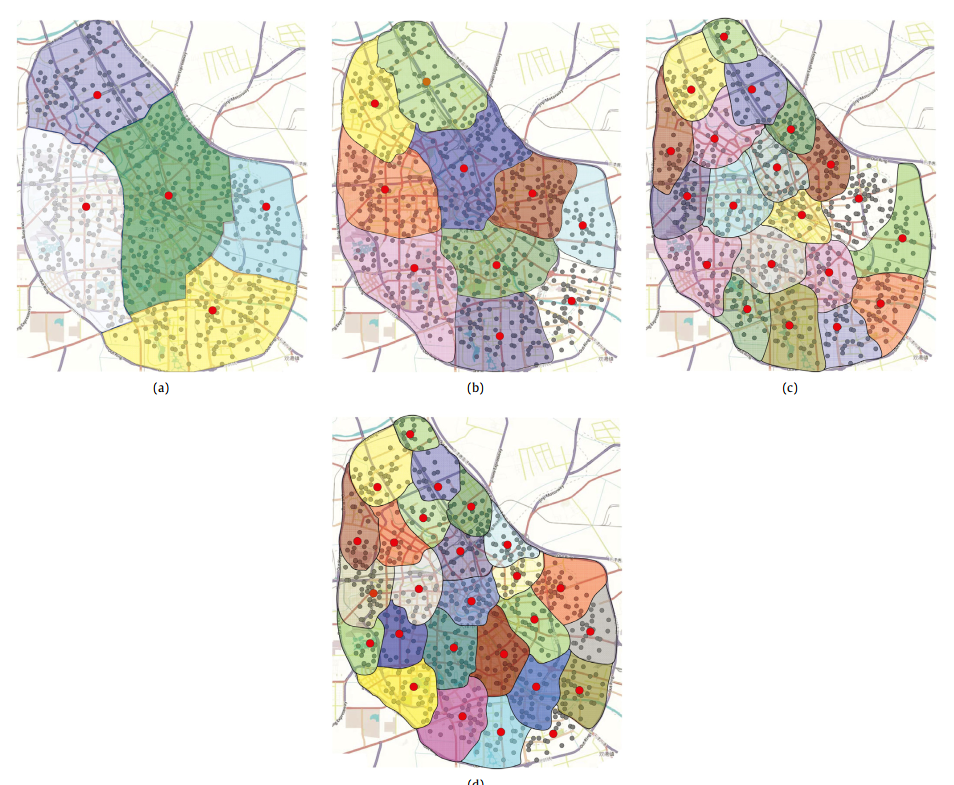
Figure 1: K-Means Clustering Overlay on GIS Mapping
References
Yang, J., Han, Y., Wang, Y., Jiang, B., Lv, Z., & Song, H. (2017). Optimization of real-time traffic network assignment based on IoT data using DBN and clustering model in smart city. Future Generation Computer Systems. doi: 10.1016/j.future.2017.12.012